Viser innlegg med etiketten :: human behavior. Vis alle innlegg

torsdag 30. september 2010

URBAN AGRICULTURE HIGH SCHOOL IN NEW YORK!!!

Today a new school is born and important change is rolling forward towards our alternative legacy!!!!

from http://farmtogethernow.org/2010/09/30/urban-ag-high-school/
September 30, 2010

We just got this press release about an exciting development in education out in New York:

Just Food and Partners Announce Launch of Farm School NYC:
The New York City School of Urban Agriculture
Just Food and an alliance of local horticultural and food justice organizations are pleased to announce the official launch of Farm School NYC: The New York City School of Urban Agriculture.  The school will offer a unique, community-based certificate program with enrollment beginning in January 2011.  The mission of the school is to provide comprehensive professional training in urban agriculture, while spurring positive local action on issues of food access and social, economic and racial justice.
Community gardens and urban farms throughout the city will serve as outdoor classrooms, and their neighborhoods and gardeners as inspiration for a vibrant, fair local food system that nourishes bodies and minds.  Training programs will be accessible to adults of all educational backgrounds and income levels.  In particular, Farm School NYC targets New York City residents unable to access traditional agricultural education and for whom skills in urban food production can contribute to reduced hunger and diet-related diseases that disproportionately affect low-income city residents.
“For the first time, New Yorkers and city dwellers from all over will have access to agricultural training that directly relates to the unique setting of urban agriculture,” says Karen Washington, a nationally-recognized urban farming pioneer from the Bronx, and a member of the school’s Executive Board. “We grow it so we know it, and we’ve shown that city farming can make a huge difference in the health and nutrition of low-income urban communities.”
Farm School NYC will offer instruction in sustainable agriculture, entrepreneurship and food systems management.  “Our goal for the school is to build and share knowledge within our communities and improve local access to healthy food throughout the city,” said Jacquie Berger, Executive Director of Just Food. “By bringing urban farming skills to a much broader population, Farm School NYC will magnify the impact of urban agriculture on community health in New York City and beyond.”
Learn More:  Visit Farm School NYC’s website: www.justfood.org/farmschoolnyc
FOR MORE INFORMATION CONTACT:
Molly Culver & Eric Thomann
Interim Co-Directors
Farm School NYC, Just Food
212-645-9880×224
farmschoolnyc@justfood.org

SOME MORE ARLENE BIRT : VISUAL COMMUNICATIONS OF FOOD BACKGROUNDS

Background Stories: Visual Communication of Food Backgrounds . 2006

Visit www.backgroundstories.com for the current project.
Masters Thesis from Design Academy Eindhoven, The Netherlands.

To encourage consumer awareness of how their food choices affect not only themselves, but also global environment and society, consumers need to feel a connection with the environmental, social and economical impacts of their foods.
This thesis is a case for a new direction in product labeling, corporate communication and advertising.
For the exploration of this topic, a focus is taken on foods. As an industry, food already has a high level of trace-ability, due to growing food safety concerns (especially following outbreaks of Foot and Mouth and other such diseases), and consumer demand.
As indicators to support this argument, social and environmental issues are growing in importance in both the corporate sphere and in the public eye. Corporate violations of social responsibility have threatened consumer trust, and thereby lead to a greater consumer demand for information, which thus causes increased transparency on the part of corporations. In business, there is a need to communicate on changes towards social-responsibility. In advertising, the changing role of the ‘brand’ and the continual evolution of advertising (currently away from image-based (ego) appeal) highlight a need for a new direction in marketing communication. Technology already allows such viewing behind the product: using search and tracking tools such as Google, GPS, RFID and RFD tags, consumers can pinpoint and track products through their virtual networks.

Designers are in a prime position to be able to communicate complex background information to consumers. Stefano Marzano of Phillips Design says that as designers, “if we can’t change the nature of people, we can affect their behavior: By designing the environment.”

Much like the Nutrition Facts label changed consumer behavior because it made direct connections between the nutrients of the food and individual health – over time – such communication on the backgrounds can change consumer purchasing behavior. The ‘dolphin-free tuna’ label is another example of this established connection: between buying tuna and harming dolphins. Prior to the money that was put into media to communicate the message behind the ‘dolphin-safe’ mark, consumers were unaware of the connection.

VISUALIZING GROCERY IMPACTS


Visualizing Grocery Impacts is a data-driven and interactive installation that will help individuals better understand how their daily purchases have global social and environmental impact. In an installation which mimics a super-market, products with custom labels can be collected from the shelves by visitors, and scanned with a barcode reader that will project interactive and visual information on the productʼs background impacts (including global, ecological, political, social and cultural impacts) onto a nearby wall. The variety of visual background stories presented will display information with an activist intent as well as in a positive light to motivate consumers toward more conscious purchasing decisions. The installation will provide an innovative approach to understanding sustainability: as an intersection between digital data and the physical world.


Arlene Birt
email: arlene (at) arlenebirt.com
www.arlenebirt.com
Arlene designs for the communication of backgrounds: bringing cultural, environmental, political and historical stories into focus.
With roots in the Midwest U.S. and a background in journalism, advertising, sustainable development, graphic and product design, Arlene graduated with a Masters in Humanitarian Design at Design Academy Eindhoven (the Netherlands). She is an occassional design writer and was a 2004-05 Fulbright grant recipient to the Netherlands, where she focused on the visual explanation of product life-cycles. She's currently fascinated by telling visual stories with brand public relations agency Haberman and mapping the 'water flows' of the Twin Cities. Arlene is adjunct faculty of the Minneapolis College of Art and Design Sustainability Certificate program and catalogs critique and inspiration for the visual communication of background stories on www.arlenebirt.com/blog.


søndag 25. april 2010

ECO-FOOTPRINTS AND GLOBAL BIO-CAPACITY

The measurement called "eco-footprint" is an abstract size or number based on the earths global bio capacity divided by the number of people living on the planet at any time. Meaning as time goes and we become more people our ideal eco-footprint shrinks, at the same time as our consumption increases and reduces the planets bio-capacity. In 2008 the individual ideal eco-footprint was 1,3 gha (global hectars), while the average Norwegian eco-footprint was 6,8. In the following article I will try to explain the logics behind the eco-footprint way of thinking based on THE LIVING PLANET REPORT from 2008.
Based on the illustration of "food-print" (from the article on "how food shapes our cities and landscape"), the first illustrations show the eco-footprint of an average Norwegian in 2009 (68 000m2/6,8gha in dark grey) and the ideal individual eco-footprint of 2008 (13 000m2/or 1,3gha in green). The illustration below shows the footprints outstretch of 50 people. Both illustrations shown in comparison to the football stadium of Bergen at Minde, the stop next to access-point:Wergeland.


The Ecological Footprint measures humanity’s demand on the biosphere in terms of the area of biologically productive land and sea required to provide the resources we use and to absorb our waste. In 2005 the global Ecological Footprint was 17.5 billion global hectares (gha), or 2.7 gha per person (a global hectare is a hectare with world-average ability to produce resources and absorb wastes). On the supply side, the total productive area, or biocapacity, was 13.6 billion gha, or 2.1 gha per person.
A country’s footprint is the sum of all the cropland, grazing land, forest and fishing grounds required to produce the food, fibre and timber it consumes, to absorb the wastes emitted when it uses energy, and to provide space for its infrastructure. Since people consume resources and ecological services from all over the world, their footprint sums these areas, regardless of where they are located on the planet.

Biocapacity is not evenly distributed around the world. The eight countries with the most biocapacity – the United States, Brazil, Russia, China, Canada, India, Argentina and Australia – contain 50 per cent of the total world biocapacity.
In prior years, Ecological Footprint accounts included an additional component reflecting the electricity generated by nuclear power plants. To improve methodological consistency, this component is no longer included in the accounts. This does not mean that the use of nuclear energy is free of risk or demands on the environment, only that these risks and demands are not easily expressed in terms of biocapacity.

Humanity’s footprint first exceeded the Earth’s total biocapacity in the 1980s; this overshoot has been increasing since then (Figure 23). In 2005, demand was 30 per cent greater than supply.
Humanity’s demand on the planet’s living resources, its Ecological Footprint, now exceeds the planet’s regenerative capacity by about 30 per cent. This global overshoot is growing and, as a consequence, ecosystems are being run down and waste is accumulating in the air, land and water. The resulting deforestation, water shortages, declining biodiversity and climate change are putting the well-being and development of all nations at increasing risk.
Humanity’s demand on the planet has more than doubled over the past 45 years as a result of population growth and increasing individual consumption. In 1961, almost all countries in the world had more than enough capacity to meet their own demand; by 2005, the situation had changed radically, with many countries able to meet their needs only by importing resources from other nations.
The Living Planet Index shows that wild species and natural ecosystems are under pressure across all biomes and regions of the world. The direct, anthropogenic threats to biodiversity are often grouped under five headings:
:: habitat loss, fragmentation or change, especially due to agriculture
:: overexploitation of species, especially due to fishing and hunting
:: pollution
:: the spread of invasive species or genes
:: climate change

ECOSYSTEM SERVICES
Humanity depends on healthy ecosystems, they support or improve our quality of life, and without them, the Earth would be uninhabitable. The Millennium Ecosystem Assessment (MA) describes four categories of ecosystem services, starting with the most fundamental:
:: supporting services such as nutrient cycling
:: soil formation and primary production provisioning services such as the production of food, freshwater, materials or fuel
:: regulating services including climate and
flood regulation, water purification, pollination and pest control
:: cultural (including aesthetic, spiritual, educational and recreational) services.

The MA reported that biodiversity loss contributes to food and energy insecurity, increased vulnerability to natural disasters such as floods or tropical storms, poorer health, reduced availability and quality of water, and the erosion of cultural heritage.
Most supporting, regulating and cultural ecosystem services are not bought and sold commercially, so have no market value. Their decline sends no warning signal to the local or global economy. Markets lead to decisions about resource use that maximize benefits to individual producers and consumers, but often undermine the biodiversity and ecosystem services on which the production and consumption ultimately depend. The value of biodiversity to human well-being, while not readily quantifiable in monetary terms, could be the difference between a planet that can support its human population and one which cannot.

If overshoot continues to increase, what will the future hold?
Under assumptions of rapid global economic growth and a shift to a balanced mix of energy sources, the Intergovernmental Panel on Climate Change projects that annual carbon emissions will more than double by 2050. Moderate United Nations estimates show global population growing to 9 billion over the same period, while FAO projections show increasing consumption of food, fibre and forest products. Furthermore, if present management schemes persist, fisheries are projected to decline by more than 90 per cent by 2050.
Figure 31 shows the implications of these scenarios for humanity’s footprint through to mid-century. The 2005 overshoot of 30 per cent would reach 100 per cent in the 2030s even if recent increases in agricultural yields continue. This means that biological capacity equal to two planet Earths would be required to keep up with humanity’s resource demands and waste production.
This business-as-usual scenario is conservative as it assumes no unpleasant surprises: no biocapacity losses due to freshwater shortages, no feedback loops that cause a changing climate to reach tipping points, no damage by pollution, and no other factors that could cause biocapacity to decrease.

Ending overshoot means closing the gap between humanity’s footprint and available biocapacity. Five factors determine the size of this gap (Figure 33).
On the demand side, the footprint is a function of population size, the goods and services each person consumes, and the resource and waste intensity of these goods and services. Reductions in population, individual consumption, and the resources used or wastes emitted in producing goods and services all result in a smaller footprint.
On the supply side, biocapacity is determined by the amount of biologically productive area available, and the productivity of that area.
There are many different strategies that could reduce the gap between human demand on nature and the availability of ecological
capacity. Each of these strategies can be represented as a sustainability wedge that shifts the business-as-usual path towards one in which, when these wedges are combined, overshoot is eliminated.
One way of organizing wedges is to link them to the three factors that determine footprint. Some strategies in the per person consumption and technology wedges, such as insulating buildings, produce quick results for shrinking overshoot. Within a wedge, many interventions are possible. Individual consumption can be reduced by designing cities in which walking is preferable to driving. Technological innovations can increase the efficiency of resource use, such as meeting communication needs with cellular phones rather than landlines. Rehabilitation of degraded lands can increase agricultural yields while minimizing increases in footprint associated with agricultural expansion.
Alternatively, wedges can also be organized around major consumption categories such as food, shelter, mobility, goods and services, along with population size. The footprint of food, for example, might be reduced by optimizing the relationship between the distance it is transported and the efficiency with which it can be locally produced. The energy efficiency of residential and commercial buildings can often be dramatically increased, and utilities supporting them can be integrated so that wastes from one system serve as inputs for another.
The ecosystem approach is defined by the Convention on Biological Diversity as a strategy for the integrated management of land, water and living resources that promotes conservation and sustainable use in an equitable way. The ecosystem approach recognizes the relationships between healthy and resilient ecosystems, biodiversity conservation and human well-being. It sets out a series of 12 principles for decision making and action spanning the environmental, economic and social dimensions of sustainability.
It can be applied on any scale from local to global, and encompasses initiatives ranging from large-scale regional planning, such as integrated river basin management, to sustainable commodities management at the farm level. www.cbd.int/ecosystem/principles.shtml

:: Governments set the policy and economic frameworks within which people must live and the private sector must operate; these must encourage and reward sustainability and promote population stabilization
:: The private sector must be committed to good stewardship of the planet, should be committed to the “triple-bottom-line” approach of economic, social and environmental success, and must provide people with solutions that enable them to live sustainably
:: Civil society needs to be aware of the challenges, elect governments who will set policies in their best long-term interests, and exercise personal choice that demands and favors sustainable produce and products from the private sector.

That was it so far, further recommended reading can be the TEEB report;
The Economics of Ecosystems and Biodiversity
(see the article on Minister of Finance called for further development of economic instruments to protect nature).

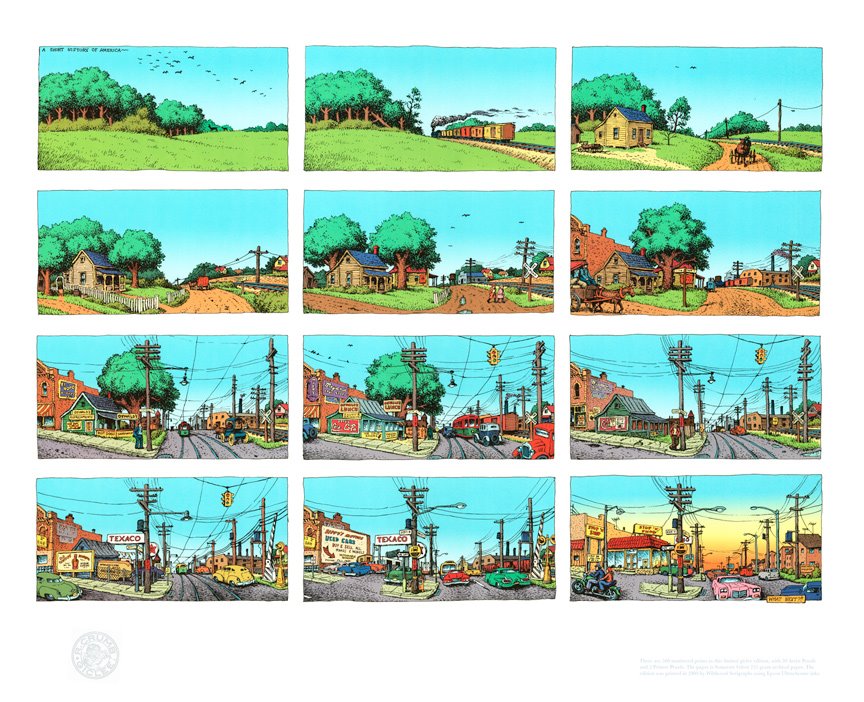
BACK AND FORTH WITH HISTORY

A COMMON TRANSECT

A common transect has a simple expansion of the typical section cut technique. In a natural condition this slices through a number of ecosystems. The definition from the CATS site gives a quick idea of the concept of transect which borrows from the ecological concept: "A transect is a cut or path through part of the environment showing a range of different habitats. Biologists and ecologists use transects to study the many symbiotic elements that contribute to habitats where certain plants and animals thrive. Human beings also thrive in different habitats. Some people prefer urban centers and would suffer in a rural place, while others thrive in the rural or sub-urban zones. Before the automobile, American development patterns were walkable, and transects within towns and city neighborhoods revealed areas that were less urban and more urban in character. This urbanism could be analyzed as natural transects are analyzed." (from LANDSCAPE+URBANISM)

This article is very interesting so I can recomend reading it on Representing Transects

but the comments to the post is starting a good discussion to;

michelle said...

Great Post. I have always been attracted to the simplicity of the transect and its ability to convey a lot of information, albeit general, in a graphically pleasing way. Applying the transect to the urban growth boundary is a tricky, but I think doable task.

There is a bit of a disconnect between the UGB line on the map and the resulting landscape. The development takes time to catch up with planning. I was driving through Damascus the other day the the farms gave way quickly to the dense neighborhoods. Between those were the remnants of the 3-5 acre rural lots. It was all in all a spotty, hard to comprehend landscape. It would make for an interesting looking transect. What I see happening more and more is the urban growth boundary is not a circle but more of a blob with arms. It would be interesting to see what a transect looks like that starts in the UGB travels through the rural area and reenters the UGB in another arm.

Thanks for the collection of info.

Michelle, December 30, 2009 1:24 PM

ABDaigle said...

Michelle, I have been thinking about your post, because the application of the Transect to walkable urbanism intends just that - the wave-like action of urban separated by rural (although each "urban" area has its own characteristics and level of urbanism, from hamlet to village to city to regional center).
The primary point is that each "increment" of urbanism must be, at minimum, an approximate 1/4 mile" pedestrian shed" to make it truly sustainable (i.e., meaning most daily needs are within walking distance and rich with a diversity of living, working and shopping opportunities).
This assumes the largest lots are primarily on the neighborhood edge as a transition from urban to rural, adjacent preferably to rural agriculture, and that a mix of ag and preserved "wilderness" likewise separate communities.
This concept can be valid in a number of urban settings, from small town neighborhoods to highly urban areas.
While with PlaceMakers, we designed a community of eight hamlets and saved the majority of land between each one as natural landscape. (The original plan had been to fully develop in sprawl mode the entire land area.) The Waters is outside Montgomery, AL, and hamlet one is well underway. Here is a link to the Master Plan:
http://www.thewatersal.com/WatersMasterPlan.pdf
It is a good example of how one can plan complete neighborhoods, maintain a small town feel while building compactly to ensure walkability, and conserve land. There are many design tools to accomplish similar effects in more urban areas, from conservation easements to urban agriculture to regional parks and greenways.
I love Germany, where the urban edge ends abruptly and agriculture or forests take over. (Large suburban size lots are almost nonexistent there, where efficiency seems to trump other considerations and public shared space is well-designed and abundant.)

Ann Daigle, Community Design & Plan Strategy, March 3, 2010 1:08 PM

ROADS GONE WILD

No street signs. No crosswalks. No accidents. Surprise: Making driving seem more dangerous could make it safer.
(from a WIRED article
Issue 12.12 - December 2004)

Hans Monderman (Engineer of Livable Streets,) is a traffic engineer who hates traffic signs. Oh, he can put up with the well-placed speed limit placard or a dangerous curve warning on a major highway, but Monderman considers most signs to be not only annoying but downright dangerous. To him, they are an admission of failure, a sign - literally - that a road designer somewhere hasn't done his job. "The trouble with traffic engineers is that when there's a problem with a road, they always try to add something," Monderman says. "To my mind, it's much better to remove things." .......

Riding in his green Saab, we glide into Drachten, a 17th-century village that has grown into a bustling town of more than 40,000. We pass by the performing arts center, and suddenly, there it is: the Intersection. It's the confluence of two busy two-lane roads that handle 20,000 cars a day, plus thousands of bicyclists and pedestrians. Several years ago, Monderman ripped out all the traditional instruments used by traffic engineers to influence driver behavior - traffic lights, road markings, and some pedestrian crossings - and in their place created a roundabout, or traffic circle. The circle is remarkable for what it doesn't contain: signs or signals telling drivers how fast to go, who has the right-of-way, or how to behave. There are no lane markers or curbs separating street and sidewalk, so it's unclear exactly where the car zone ends and the pedestrian zone begins. To an approaching driver, the intersection is utterly ambiguous - and that's the point.

Monderman and I stand in silence by the side of the road a few minutes, watching the stream of motorists, cyclists, and pedestrians make their way through the circle, a giant concrete mixing bowl of transport. Somehow it all works. The drivers slow to gauge the intentions of crossing bicyclists and walkers. Negotiations over right-of-way are made through fleeting eye contact. Remarkably, traffic moves smoothly around the circle with hardly a brake screeching, horn honking, or obscene gesture. "I love it!" Monderman says at last. "Pedestrians and cyclists used to avoid this place, but now, as you see, the cars look out for the cyclists, the cyclists look out for the pedestrians, and everyone looks out for each other. You can't expect traffic signs and street markings to encourage that sort of behavior. You have to build it into the design of the road.".....

In Denmark, the town of Christianfield stripped the traffic signs and signals from its major intersection and cut the number of serious or fatal accidents a year from three to zero. In England, towns in Suffolk and Wiltshire have removed lane lines from secondary roads in an effort to slow traffic - experts call it "psychological traffic calming." A dozen other towns in the UK are looking to do the same. A study of center-line removal in Wiltshire, conducted by the Transport Research Laboratory, a UK transportation consultancy, found that drivers with no center line to guide them drove more safely and had a 35 percent decrease in the number of accidents.

In the US, traffic engineers are beginning to rethink the dictum that the car is king and pedestrians are well advised to get the hell off the road. In West Palm Beach, Florida, planners have redesigned several major streets, removing traffic signals and turn lanes, narrowing the roadbed, and bringing people and cars into much closer contact. The result: slower traffic, fewer accidents, shorter trip times. "I think the future of transportation in our cities is slowing down the roads," says Ian Lockwood, the transportation manager for West Palm Beach during the project and now a transportation and design consultant. "When you try to speed things up, the system tends to fail, and then you're stuck with a design that moves traffic inefficiently and is hostile to pedestrians and human exchange.".....

CHAOS = COOPERATION

1. Remove signs: The architecture of the road - not signs and signals - dictates traffic flow.

2. Install art: The height of the fountain indicates how congested the intersection is.

3. Share the spotlight: Lights illuminate not only the roadbed, but also the pedestrian areas.

4. Do it in the road: Caf�s extend to the edge of the street, further emphasizing the idea of shared space.

5. See eye to eye: Right-of-way is negotiated by human interaction, rather than commonly ignored signs.

6. Eliminate curbs: Instead of a raised curb, sidewalks are denoted by texture and color.

read the full article here

Hans Monderman, Engineer of Livable Streets, died in 2008.

This is what Kathy Madden says about his work;

"2007 we met with Hans in the Netherlands and he told us that although his work started by analyzing why accidents occurred in some areas and why they didn't happen in others, he said that there was one essential goal of calming any intersection. This goal was simply to slow the traffic down to where there could be eye contact between the various people who are meeting each other at the intersection - on foot or in a vehicle. While we were visiting him we had the honor to go with him to several of the intersections that he had worked on and experience them first hand. It was the most remarkable experience to walk through the intersection and, as a pedestrian, have the right of way just prior to bicycles, buses, private vehicles and trucks. One bus pulled up beside us and the driver opened the window and said "Mr. Monderman - I just wanted to thank you for what you did to this street - it works so much better now". Older people were casually riding on bicycles doing their errands and everyone was doing something we had not seen in a long time - using hand signals to indicate when they were turning. The experience we had walking in these "shared" intersections was like walking in slow motion - almost like being in some sort of ballet or slow dance! We have much to thank Hans Monderman for and much to do to utilize if his ideas and experience in US citites today."

Kathy Madden
Project for Public Spaces

mandag 8. mars 2010

OUR RESISTANCE TO CHANGE HABITS

The social anthropology essay, thoughts to be further developed through the diploma work;
Please share your experiences and thoughts on the subjects!
Basdiplom Social Antr Essay Laura Ve

review from tutor:

Tenkte jeg skulle gi noen mer konkrete kommentarer på selve essayet;

Du har skrevet en bra oppgave. Jeg liker både innholdet og engasjementet. Faren er likevel at det blir "for mye" engasjement og at oppgaven blir litt ensidig og lite kritisk. Jeg hadde gjerne sett at du mer kritisk gikk inn i den rollen samfunn og kultur, gjennom hverdagslivet, har i å bidra til å vedlikeholde vår livsstil og hva som er omkostningene ved å bryte ut. Omkostninger som er knyttet til ulike former for kapital - sosial, kulturell eller økonomisk. Jeg likte det du tok opp om rollemodeller og tilgjengelighet på gode alternativ. Det er et nivå som griper inn på hverdagsplanet.

I forhold til håp er jeg enig i at håpløshet og fatalisme ikke er et godt utgangspunkt, men mener at håp (ureflektert i form av "det bedrer seg nok" er vel så ødeleggende. Jeg vil kanskje mene at virtue ethics / dydsetikk handler om det - å gjøre det rette fordi det er det rette uansett om man tror det vil lose problemene. Fokuserer man på målet, blir det konsekvensetikk. Generelt er etikk et felt som er alt for lite vektlagt. Vurderinger av plan og arkitektur i forhold til ulike etiske systemer er dessverre veldig fraværende. Så et pluss for det.

(eng. You have written a good essay. I like both the content and commitment. The danger, however, that it becomes too much commitment and that the task is a bit one-sided and not very critical. I would have liked to see that you more critical entered the role of society and culture through everyday life, in helping to maintain our lifestyle and what are the costs of breaking out. Costs associated with various forms of capital - social, cultural or economic. I liked that you took up the role models and the availability of good alternatives. There is a level that interferes with the everyday level.
In terms of hope, I agree that the hopelessness and fatalism is not a good starting point, but believe that hope ,unreflected in the form of "things will be all right" is just as devastating. I believe that virtue ethics / dydsetikk about it - to do the right thing because it is the right thing regardless of whether you think it will solve the problems. Focusing on the goal; consequential ethics. In general, ethics is a field that is far too little emphasized. Reviews of urban planning and architecture in relation to various ethical systems is unfortunately very absent. A plus for this.)

Uansett, en grundig og god oppgave.

Lykke til videre!
Tord