Viser innlegg med etiketten :: oil dependency. Vis alle innlegg

tirsdag 27. juli 2010

BERGEN - LANDSCAPE, PRODUCTIVE LAND & NEEDS

The  city of Bergen is situated on the west coast of Norway and has been one of the most important national (and international) harbours in its history, with connection to the rest of the world mainly by sea in its first hundred years. 

The city is situated in a landscape with strong
caracter surrounded by 7 more or less steep
mountains, shaped in arcs called Bergens buene.
This hilly topography causes the caracteristic
humid climate the city is known for; mild humid
air from the North Sea and Atlantic comes in and
is pushed up along the mountain sides, causing the
temperature to drop and rain. The topography of
Bergen also makes city-planning challenging,
regarding settlement pattern and infrastrucutral
mobility strategies connected to settlement and
densification.


After centuries of beeing a city connected by sea
and horse (and by foot naturally), from 1900
Bergen developed connection-lines by rail.


Bergens banen crossing the mountain to the
eastern part of Norway (Oslo) was built in the
beginning of the 20th century. But also within its
city-limits and to neighboring municipalities (now
some included into Bergen Municipality) light rail
lines were developed, one of them turning in
todays light rail stop, access-point : Wergeland.


From the middle of the 20th century the private
car was more and more prioritated, and by massive
development of the road system a new settlement
pattern spread out caused by the accessibility of
the car.


Later plane traffic for people and goods has also
escalated. Connecting Bergen to the rest og the
world with oil.


This development of Bergen (prioritating private car infrastructure) has continued up until today,
and still seems to be the political mentality in the Region of Bergen.
Bergen Municipality masters an area of 465,68km2. 50% of this landscape is above 160m. 4,4% is
freshwater surface.


The urban areas are spread out over 108,5 km2, 23,3% of the total area of the Municipality,
divided into eight boroughs. With 267 860 inhabitants it is not a big city.


3,5% of Bergens area is farmland supporting only 11 780 people with food, on a vegetarian diet.
On a meat diet it is only sufficient to support 1980 peole through the year.


If all the 267 860 inhabitants was living on a vegetarian diet and it was all to be produced
within the Municipality it would require 333,58 km2, 71,6% of the landscape floor.


The Goverments amitions for the future is that we must be able to support ourselves
with 50% of consumed food within national borders to not put ourselves in a voulnerable position.
Based on these goals and ambitions to lower our eco-footprints
a change in local political mentality is required.

torsdag 15. juli 2010

VALUATION OF LAND AND FUTURE ACCESS TO PRODUCTIVE SOIL


In the local paper BT yesterday we could read an article by Gerd Lithun, cand. agric., at the University in Bergen (UiB).

Here is a short summary in english, whole article can be read here, (norwegian only I´m afraid).

By Norwegian law polititians are committed to see to that productive soil is used to no other purpose (than production of food, fibers etc).
Still 13 000 acres (52,61 km2, 11,3% of the total area of Bergen municipality) of productive soil were re-disposed for other purposes, only last year, an area  equivalent to 1100 football fields.
In the period from 2000-2009 162 504 acres (657,63 km2, 141,22% of the total area of Bergen municipality), has been re-disposed for roads, housing, industrial zones, schools, sports facilities, etc. Only in Hordaland region 7950 acres (32,17km2) were re-disposed.
This area of productive soil can not be replaced after its buildt upon as it takes 100 years to produce 1cm of productive soil. In the same period only 104 187 acres was cultivated, but it cannot replace the soil taken out of production, as it does not hold the same qualities. Every year we reduce our most productive areas.

Compared to other nations we have a lot of area relative to number of citizens, but only small zones capable to produce food or fodder. Only 3% of Norwegian land area is productive, and only one third of this area is of such good quality it is able to produce corn. In 2008 this was equivalent to 2,2 acres pr inhabitant, or 8900 m2 (2,7 acres pr inhab. is the average on world basis). 2,2 acres of good quality can produce 880kg of corn or 1320kg grass. This is enough to feed up 3,5 pigs for slaughter, or about 1/4 of a milk producing cow. But most of the productive fields we hold is best suited to produce fodder or grass due to climatic conditions.

1 million acres of irreplaceable land is lost the last 50 years in Norway. As long as it is happening little by little it does not attract much attention.

With the productive land we have we are able to feed 50% of the population through the year, or all of the inhabitants half the year. The rate of self-supply for Norway in 2008 was calculated 52% on an energy basis (kcal). We are able to produce almost enough milk and meat but we need to import corn. But large numbers of the milk and meat production is based on imported fodder.
Last year the spring was dry and the harvesting season wet so only 15% of the produces corn was of quality for human consumption.

Calculations show that the Norwegian population will increase with 1 mill by 2030. To maintain a self-sufficiency level of 50% we need to increase the production by 20%. Are we able to achieve this?
What happens if we will no longer have access to rent productive fields and cheap labor in other countries? Only 10% of world production is sold on the world market, the rest is regionally or locally consumed.

8th of June this year we heard on the news that Sandnes municipality plan to build on 2000 acres of the best productive land we have in this country. Land should not be managed by the municipalities alone if they can make this decision without national discussion.

søndag 25. april 2010

ECO-FOOTPRINTS AND GLOBAL BIO-CAPACITY

The measurement called "eco-footprint" is an abstract size or number based on the earths global bio capacity divided by the number of people living on the planet at any time. Meaning as time goes and we become more people our ideal eco-footprint shrinks, at the same time as our consumption increases and reduces the planets bio-capacity. In 2008 the individual ideal eco-footprint was 1,3 gha (global hectars), while the average Norwegian eco-footprint was 6,8. In the following article I will try to explain the logics behind the eco-footprint way of thinking based on THE LIVING PLANET REPORT from 2008.
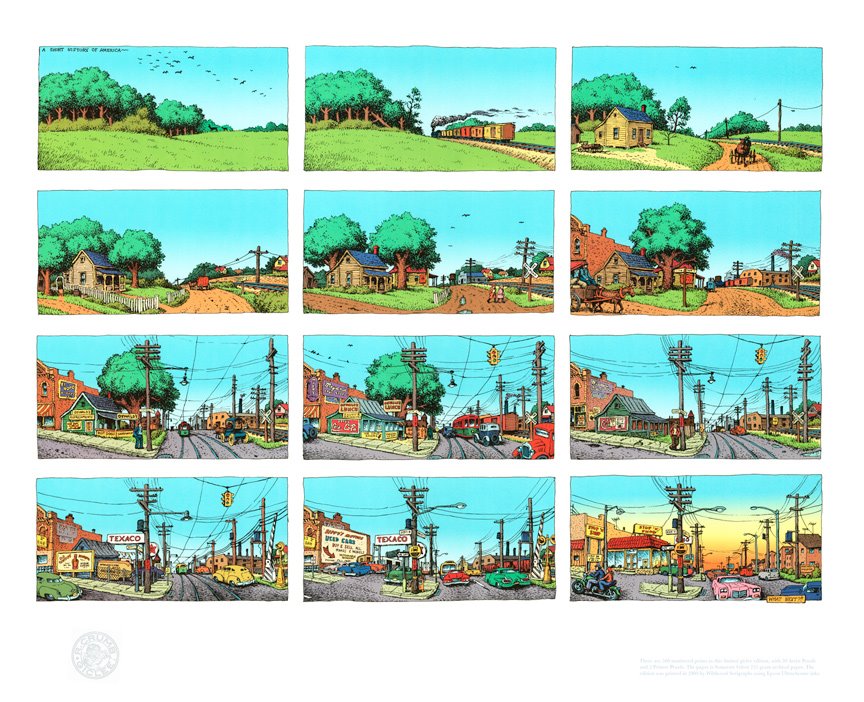
Based on the illustration of "food-print" (from the article on "how food shapes our cities and landscape"), the first illustrations show the eco-footprint of an average Norwegian in 2009 (68 000m2/6,8gha in dark grey) and the ideal individual eco-footprint of 2008 (13 000m2/or 1,3gha in green). The illustration below shows the footprints outstretch of 50 people. Both illustrations shown in comparison to the football stadium of Bergen at Minde, the stop next to access-point:Wergeland.


The Ecological Footprint measures humanity’s demand on the biosphere in terms of the area of biologically productive land and sea required to provide the resources we use and to absorb our waste. In 2005 the global Ecological Footprint was 17.5 billion global hectares (gha), or 2.7 gha per person (a global hectare is a hectare with world-average ability to produce resources and absorb wastes). On the supply side, the total productive area, or biocapacity, was 13.6 billion gha, or 2.1 gha per person.
A country’s footprint is the sum of all the cropland, grazing land, forest and fishing grounds required to produce the food, fibre and timber it consumes, to absorb the wastes emitted when it uses energy, and to provide space for its infrastructure. Since people consume resources and ecological services from all over the world, their footprint sums these areas, regardless of where they are located on the planet.

Biocapacity is not evenly distributed around the world. The eight countries with the most biocapacity – the United States, Brazil, Russia, China, Canada, India, Argentina and Australia – contain 50 per cent of the total world biocapacity.
In prior years, Ecological Footprint accounts included an additional component reflecting the electricity generated by nuclear power plants. To improve methodological consistency, this component is no longer included in the accounts. This does not mean that the use of nuclear energy is free of risk or demands on the environment, only that these risks and demands are not easily expressed in terms of biocapacity.

Humanity’s footprint first exceeded the Earth’s total biocapacity in the 1980s; this overshoot has been increasing since then (Figure 23). In 2005, demand was 30 per cent greater than supply.
Humanity’s demand on the planet’s living resources, its Ecological Footprint, now exceeds the planet’s regenerative capacity by about 30 per cent. This global overshoot is growing and, as a consequence, ecosystems are being run down and waste is accumulating in the air, land and water. The resulting deforestation, water shortages, declining biodiversity and climate change are putting the well-being and development of all nations at increasing risk.
Humanity’s demand on the planet has more than doubled over the past 45 years as a result of population growth and increasing individual consumption. In 1961, almost all countries in the world had more than enough capacity to meet their own demand; by 2005, the situation had changed radically, with many countries able to meet their needs only by importing resources from other nations.
The Living Planet Index shows that wild species and natural ecosystems are under pressure across all biomes and regions of the world. The direct, anthropogenic threats to biodiversity are often grouped under five headings:
:: habitat loss, fragmentation or change, especially due to agriculture
:: overexploitation of species, especially due to fishing and hunting
:: pollution
:: the spread of invasive species or genes
:: climate change

ECOSYSTEM SERVICES
Humanity depends on healthy ecosystems, they support or improve our quality of life, and without them, the Earth would be uninhabitable. The Millennium Ecosystem Assessment (MA) describes four categories of ecosystem services, starting with the most fundamental:
:: supporting services such as nutrient cycling
:: soil formation and primary production provisioning services such as the production of food, freshwater, materials or fuel
:: regulating services including climate and
flood regulation, water purification, pollination and pest control
:: cultural (including aesthetic, spiritual, educational and recreational) services.

The MA reported that biodiversity loss contributes to food and energy insecurity, increased vulnerability to natural disasters such as floods or tropical storms, poorer health, reduced availability and quality of water, and the erosion of cultural heritage.
Most supporting, regulating and cultural ecosystem services are not bought and sold commercially, so have no market value. Their decline sends no warning signal to the local or global economy. Markets lead to decisions about resource use that maximize benefits to individual producers and consumers, but often undermine the biodiversity and ecosystem services on which the production and consumption ultimately depend. The value of biodiversity to human well-being, while not readily quantifiable in monetary terms, could be the difference between a planet that can support its human population and one which cannot.

If overshoot continues to increase, what will the future hold?
Under assumptions of rapid global economic growth and a shift to a balanced mix of energy sources, the Intergovernmental Panel on Climate Change projects that annual carbon emissions will more than double by 2050. Moderate United Nations estimates show global population growing to 9 billion over the same period, while FAO projections show increasing consumption of food, fibre and forest products. Furthermore, if present management schemes persist, fisheries are projected to decline by more than 90 per cent by 2050.
Figure 31 shows the implications of these scenarios for humanity’s footprint through to mid-century. The 2005 overshoot of 30 per cent would reach 100 per cent in the 2030s even if recent increases in agricultural yields continue. This means that biological capacity equal to two planet Earths would be required to keep up with humanity’s resource demands and waste production.
This business-as-usual scenario is conservative as it assumes no unpleasant surprises: no biocapacity losses due to freshwater shortages, no feedback loops that cause a changing climate to reach tipping points, no damage by pollution, and no other factors that could cause biocapacity to decrease.

Ending overshoot means closing the gap between humanity’s footprint and available biocapacity. Five factors determine the size of this gap (Figure 33).
On the demand side, the footprint is a function of population size, the goods and services each person consumes, and the resource and waste intensity of these goods and services. Reductions in population, individual consumption, and the resources used or wastes emitted in producing goods and services all result in a smaller footprint.
On the supply side, biocapacity is determined by the amount of biologically productive area available, and the productivity of that area.
There are many different strategies that could reduce the gap between human demand on nature and the availability of ecological
capacity. Each of these strategies can be represented as a sustainability wedge that shifts the business-as-usual path towards one in which, when these wedges are combined, overshoot is eliminated.
One way of organizing wedges is to link them to the three factors that determine footprint. Some strategies in the per person consumption and technology wedges, such as insulating buildings, produce quick results for shrinking overshoot. Within a wedge, many interventions are possible. Individual consumption can be reduced by designing cities in which walking is preferable to driving. Technological innovations can increase the efficiency of resource use, such as meeting communication needs with cellular phones rather than landlines. Rehabilitation of degraded lands can increase agricultural yields while minimizing increases in footprint associated with agricultural expansion.
Alternatively, wedges can also be organized around major consumption categories such as food, shelter, mobility, goods and services, along with population size. The footprint of food, for example, might be reduced by optimizing the relationship between the distance it is transported and the efficiency with which it can be locally produced. The energy efficiency of residential and commercial buildings can often be dramatically increased, and utilities supporting them can be integrated so that wastes from one system serve as inputs for another.
The ecosystem approach is defined by the Convention on Biological Diversity as a strategy for the integrated management of land, water and living resources that promotes conservation and sustainable use in an equitable way. The ecosystem approach recognizes the relationships between healthy and resilient ecosystems, biodiversity conservation and human well-being. It sets out a series of 12 principles for decision making and action spanning the environmental, economic and social dimensions of sustainability.
It can be applied on any scale from local to global, and encompasses initiatives ranging from large-scale regional planning, such as integrated river basin management, to sustainable commodities management at the farm level. www.cbd.int/ecosystem/principles.shtml

:: Governments set the policy and economic frameworks within which people must live and the private sector must operate; these must encourage and reward sustainability and promote population stabilization
:: The private sector must be committed to good stewardship of the planet, should be committed to the “triple-bottom-line” approach of economic, social and environmental success, and must provide people with solutions that enable them to live sustainably
:: Civil society needs to be aware of the challenges, elect governments who will set policies in their best long-term interests, and exercise personal choice that demands and favors sustainable produce and products from the private sector.

That was it so far, further recommended reading can be the TEEB report;
The Economics of Ecosystems and Biodiversity
(see the article on Minister of Finance called for further development of economic instruments to protect nature).

BACK AND FORTH WITH HISTORY

mandag 19. april 2010

TROUBLE IN THE SKY

It is fascinating how first the financial crisis, and now a volcano (crisis) shows us how much trouble we are in, caused by the way we have chosen to organize the world.

The clouds of ash from the Eyjafjallajökull volcano creeping in over Europe is showing us just how dependent we have made our selves of oil, represented by the aerial traffic. The flexibility and shorted time in travel the planes gives us, including transporting goods and important stuff like organs, makes them almost impossible to replace. The papers tell us about all the things we are running out of due to this incident of nature; organs like a hart needs to be inside its recipient within 4 hours after its last beat if it is to be a successful transplant. Almost impossible unless one live within 4 hours of the hospital doing the procedure, and the organ donor live within 4 hours to that same hospital too. But not only organ transplants have become threatened, if you live out on the islands or far into the fjords of Norway getting to the (right) hospital in time can be a challenge when the ambulance helicopters are stuck on the ground. Lives are suddenly at risk as the aerial traffic is paralyzed and on the ground. But in the future how will we adapt to this change that most likely will come? Oil fuel will become a scarce source of energy and this week shows us how vulnerable we are without it.
In Africa (Ethiopia) they are burning their roses now because without aerial traffic working in Europe they can´t get their product out to the consumers. How weird is that, flying flowers around the world? Things will change if we will make a serious attempt to lower our carbon footprint as dramatically as the goals have been set, to avoid further increased temperatures. What are people willing too give up, and how will they who loose their business adapt?

It will be interesting to see what our local politicians (with Torill Selvold Nyborg, as County Mayor, in charge) decide when they will attempt to agree on a KLIMAPLAN (plan for reducing green gas emissions,GGE) for our county that Bergen is a part of; Hordaland.
The KLIMAPLAN on a world basis is aiming to reduce their emissions based on numbers of 1991. This is argued by many to be quite an unfair share of responsibility. A global fair target will be emission rates pr. person (a footprint based on the individual), would reveal the enormous ecological space some parts of the world takes. GGE for a North American inhabitant is over 25 mill. tons pr year, while for an African it is under 5 mill. tons. A Norwegian based in Hordaland county is responsible for 13,6 mill. tons. If we in Hordaland cut our GGE with 5% every year we will in 2020 be responsible for 7,2 mill. tons individually. (source: Hordaland Naturvernforbund)
Key words to achieve this is short traveled food, bio-energy and a lower energy consumption. And political courage to dispose land and resources smarter in an ecological point of view.

torsdag 18. mars 2010

YOUR ECOLOGICAL FOOTPRINT


Follow this link and you can quiz your way to the impression of your ecological footprint...
(The calculator is based on data from Global Footprint Network's National Footprint Accounts.)

mandag 8. mars 2010

OUR RESISTANCE TO CHANGE HABITS

The social anthropology essay, thoughts to be further developed through the diploma work;
Please share your experiences and thoughts on the subjects!
Basdiplom Social Antr Essay Laura Ve

review from tutor:

Tenkte jeg skulle gi noen mer konkrete kommentarer på selve essayet;

Du har skrevet en bra oppgave. Jeg liker både innholdet og engasjementet. Faren er likevel at det blir "for mye" engasjement og at oppgaven blir litt ensidig og lite kritisk. Jeg hadde gjerne sett at du mer kritisk gikk inn i den rollen samfunn og kultur, gjennom hverdagslivet, har i å bidra til å vedlikeholde vår livsstil og hva som er omkostningene ved å bryte ut. Omkostninger som er knyttet til ulike former for kapital - sosial, kulturell eller økonomisk. Jeg likte det du tok opp om rollemodeller og tilgjengelighet på gode alternativ. Det er et nivå som griper inn på hverdagsplanet.

I forhold til håp er jeg enig i at håpløshet og fatalisme ikke er et godt utgangspunkt, men mener at håp (ureflektert i form av "det bedrer seg nok" er vel så ødeleggende. Jeg vil kanskje mene at virtue ethics / dydsetikk handler om det - å gjøre det rette fordi det er det rette uansett om man tror det vil lose problemene. Fokuserer man på målet, blir det konsekvensetikk. Generelt er etikk et felt som er alt for lite vektlagt. Vurderinger av plan og arkitektur i forhold til ulike etiske systemer er dessverre veldig fraværende. Så et pluss for det.

(eng. You have written a good essay. I like both the content and commitment. The danger, however, that it becomes too much commitment and that the task is a bit one-sided and not very critical. I would have liked to see that you more critical entered the role of society and culture through everyday life, in helping to maintain our lifestyle and what are the costs of breaking out. Costs associated with various forms of capital - social, cultural or economic. I liked that you took up the role models and the availability of good alternatives. There is a level that interferes with the everyday level.
In terms of hope, I agree that the hopelessness and fatalism is not a good starting point, but believe that hope ,unreflected in the form of "things will be all right" is just as devastating. I believe that virtue ethics / dydsetikk about it - to do the right thing because it is the right thing regardless of whether you think it will solve the problems. Focusing on the goal; consequential ethics. In general, ethics is a field that is far too little emphasized. Reviews of urban planning and architecture in relation to various ethical systems is unfortunately very absent. A plus for this.)

Uansett, en grundig og god oppgave.

Lykke til videre!
Tord

søndag 21. februar 2010

HOW FOOD SHAPES OUR CITIES AND LANDSCAPE

Every day, cities like London, Paris, Dubai, New York, Oslo or Bergen needs a large amount of food brought in to keep its inhabitants running. It is produced, transported, bought and sold, cooked, eaten and disposed of. This scenario has to happen in every city on earth, 365 days every year. In this process we change our surrounding (or some ones surrounding) landscape to large production fields. For growing grains f ex.
But as we move into cities, statistically we tend to eat more meat. And to produce meat, ten times as much grain is needed in the process to make enough for one person. Which again consumes an enormous amount of energy (oil) and produces waste and methane (green house gas) when produced.


One person on a vegetable diet can manage with approx 1350m2 of land to get 3000 kcal a day through the year. On potato diet280m2.


On a meat diet (cow) one needs approx 8200m2 of land to produce enough for one year.
To calculate approximately how much land one person “consume” one can use calculations in DIY (do it yourself) spirit for example calculate the number of calories (food energy) we require, and compare that value to the calories available from various food crops and the amount of land they need. You could refine the calculation further accounting for sources of essential nutrients: protein, carbohydrates, fat, vitamins, minerals.
An interesting article on agricultural land use takes this approach. It’s assumed that humans need 3,000 calories per day, (of course this is varying according to what you do for a living or how much work out after work). That figure is applied to a study of agricultural land used for all the food eaten in the Netherlands. For example, potato is the most efficient crop, and according to the study requires 0.2 square meters to produce 1kg, which contains 800 calories. It would therefore take 274m2 to produce enough calories for one person for one year. That’s an area less than 10m x 30m (about 33 x 100 ft). To get 3000 calories from vegetables other than potatoes requires 1314m2, eggs 2395m2, and at the high end, beef 8173.
(tinyfarmwiki.com)

Aerial view over the football stadium and surrounding football fields on Minde.
One footballfield cover about the same area needed for production of enough cow meat to support one person with 3000kcal pr day through the year, mixed with vegs this area can support a family of four.
Pink square indicates one footballfield= one persons food footprint on cow diet one year
Green square= footprint of one person on potato diet.

The calculations in this post is meant as a visual illustration of the impact the industrialization of agricultural business has on our landscape, together with the size of transportation logistics; moving all the food around for processing and retail on a global scale.
To illustrate the size, impact and variety this has google maps is a great tool.
Under follows 4 aerials in same scale 1:5000;


Fertile agricultural lanscape outside Detroit, strict and regular squares of crops.


Same sized area of Dubai. Desert and unproductive land.


Aerial over Malmø/Skaane region, most productive agricultural land in Sweeden. With its
850 000 hectars productive land this landscape can support 3,5 mill people within a hundred mile diet, the way it is run today. On a vegetarian diet the same area can support 17 mill people.
(http://www.mosaic-region.no/Produserendelandskap.html)


Bergen/Hordaland region in same scale. Working with a hundred mile diet perspective here we definitely need to think differently. Food production in spaces in between...

onsdag 17. februar 2010

Oil free life?

Try this at home! Soon our dependency would be much clearer to us I think...

tirsdag 16. februar 2010

A Farm for the Future

If you have the time and the energy this is a documentary full of information on food and the energy consumtion involved in industrialized agriculture.