torsdag 29. april 2010
IDENTITY, SENSATION AND DIVERSITY IN THE STREETS
Investigating concepts, shapes, programs and attributes of the streetscape....
What makes one block or street more interesting than others?
With inspiration from f.ex the BORNEO project in Amsterdam (WEST8), and other street views and experiences, I am searching for some qualities, attributes, intrinsic values etc that gives character to a neighborhood.
This is qualities that one can sense when first experiencing a street or neighborhood, the visual impulses and aesthetics. But living in and being a user of a place connects experiences of other dimensions to the feeling of a place and the care (or lack of care) you feel for it, in the perspective of investing time and energy to it, making it your own.
The mosaic above is different images from Paris and Malmø I took when visiting the cities last autumn. Both the cities have a lot of characteristics and varieties that I liked. Especially Paris has a rich variety in programs on street level that the neighbors use; bakery, coffeshop/cafés, grocery stores, laundry etc. Makes it possible for people to do their necessary things within their area... Which again make the area active...
The two pictures above shows the facades from both sides of Nygårdsgaten here in the City of Bergen, a varied street with different programs on street level and mostly apartments from first floor and above. How can one regulate an area or lead development into a varied expression like this? Is this possible? Maybe the Borneo development shows that it can? I have not seen it myself but the images seems promising...
søndag 25. april 2010
ECO-FOOTPRINTS AND GLOBAL BIO-CAPACITY
Based on the illustration of "food-print" (from the article on "how food shapes our cities and landscape"), the first illustrations show the eco-footprint of an average Norwegian in 2009 (68 000m2/6,8gha in dark grey) and the ideal individual eco-footprint of 2008 (13 000m2/or 1,3gha in green). The illustration below shows the footprints outstretch of 50 people. Both illustrations shown in comparison to the football stadium of Bergen at Minde, the stop next to access-point:Wergeland.
The Ecological Footprint measures humanity’s demand on the biosphere in terms of the area of biologically productive land and sea required to provide the resources we use and to absorb our waste. In 2005 the global Ecological Footprint was 17.5 billion global hectares (gha), or 2.7 gha per person (a global hectare is a hectare with world-average ability to produce resources and absorb wastes). On the supply side, the total productive area, or biocapacity, was 13.6 billion gha, or 2.1 gha per person.
A country’s footprint is the sum of all the cropland, grazing land, forest and fishing grounds required to produce the food, fibre and timber it consumes, to absorb the wastes emitted when it uses energy, and to provide space for its infrastructure. Since people consume resources and ecological services from all over the world, their footprint sums these areas, regardless of where they are located on the planet.
Biocapacity is not evenly distributed around the world. The eight countries with the most biocapacity – the United States, Brazil, Russia, China, Canada, India, Argentina and Australia – contain 50 per cent of the total world biocapacity.
In prior years, Ecological Footprint accounts included an additional component reflecting the electricity generated by nuclear power plants. To improve methodological consistency, this component is no longer included in the accounts. This does not mean that the use of nuclear energy is free of risk or demands on the environment, only that these risks and demands are not easily expressed in terms of biocapacity.
Humanity’s footprint first exceeded the Earth’s total biocapacity in the 1980s; this overshoot has been increasing since then (Figure 23). In 2005, demand was 30 per cent greater than supply.
Humanity’s demand on the planet’s living resources, its Ecological Footprint, now exceeds the planet’s regenerative capacity by about 30 per cent. This global overshoot is growing and, as a consequence, ecosystems are being run down and waste is accumulating in the air, land and water. The resulting deforestation, water shortages, declining biodiversity and climate change are putting the well-being and development of all nations at increasing risk.
Humanity’s demand on the planet has more than doubled over the past 45 years as a result of population growth and increasing individual consumption. In 1961, almost all countries in the world had more than enough capacity to meet their own demand; by 2005, the situation had changed radically, with many countries able to meet their needs only by importing resources from other nations.
The Living Planet Index shows that wild species and natural ecosystems are under pressure across all biomes and regions of the world. The direct, anthropogenic threats to biodiversity are often grouped under five headings:
:: habitat loss, fragmentation or change, especially due to agriculture
:: overexploitation of species, especially due to fishing and hunting
:: pollution
:: the spread of invasive species or genes
:: climate change
ECOSYSTEM SERVICES
Humanity depends on healthy ecosystems, they support or improve our quality of life, and without them, the Earth would be uninhabitable. The Millennium Ecosystem Assessment (MA) describes four categories of ecosystem services, starting with the most fundamental:
:: supporting services such as nutrient cycling
:: soil formation and primary production provisioning services such as the production of food, freshwater, materials or fuel
:: regulating services including climate and
flood regulation, water purification, pollination and pest control
:: cultural (including aesthetic, spiritual, educational and recreational) services.
The MA reported that biodiversity loss contributes to food and energy insecurity, increased vulnerability to natural disasters such as floods or tropical storms, poorer health, reduced availability and quality of water, and the erosion of cultural heritage.
Most supporting, regulating and cultural ecosystem services are not bought and sold commercially, so have no market value. Their decline sends no warning signal to the local or global economy. Markets lead to decisions about resource use that maximize benefits to individual producers and consumers, but often undermine the biodiversity and ecosystem services on which the production and consumption ultimately depend. The value of biodiversity to human well-being, while not readily quantifiable in monetary terms, could be the difference between a planet that can support its human population and one which cannot.
If overshoot continues to increase, what will the future hold?
Under assumptions of rapid global economic growth and a shift to a balanced mix of energy sources, the Intergovernmental Panel on Climate Change projects that annual carbon emissions will more than double by 2050. Moderate United Nations estimates show global population growing to 9 billion over the same period, while FAO projections show increasing consumption of food, fibre and forest products. Furthermore, if present management schemes persist, fisheries are projected to decline by more than 90 per cent by 2050.
Figure 31 shows the implications of these scenarios for humanity’s footprint through to mid-century. The 2005 overshoot of 30 per cent would reach 100 per cent in the 2030s even if recent increases in agricultural yields continue. This means that biological capacity equal to two planet Earths would be required to keep up with humanity’s resource demands and waste production.
This business-as-usual scenario is conservative as it assumes no unpleasant surprises: no biocapacity losses due to freshwater shortages, no feedback loops that cause a changing climate to reach tipping points, no damage by pollution, and no other factors that could cause biocapacity to decrease.
Ending overshoot means closing the gap between humanity’s footprint and available biocapacity. Five factors determine the size of this gap (Figure 33).
On the demand side, the footprint is a function of population size, the goods and services each person consumes, and the resource and waste intensity of these goods and services. Reductions in population, individual consumption, and the resources used or wastes emitted in producing goods and services all result in a smaller footprint.
On the supply side, biocapacity is determined by the amount of biologically productive area available, and the productivity of that area.
There are many different strategies that could reduce the gap between human demand on nature and the availability of ecological
capacity. Each of these strategies can be represented as a sustainability wedge that shifts the business-as-usual path towards one in which, when these wedges are combined, overshoot is eliminated.
One way of organizing wedges is to link them to the three factors that determine footprint. Some strategies in the per person consumption and technology wedges, such as insulating buildings, produce quick results for shrinking overshoot. Within a wedge, many interventions are possible. Individual consumption can be reduced by designing cities in which walking is preferable to driving. Technological innovations can increase the efficiency of resource use, such as meeting communication needs with cellular phones rather than landlines. Rehabilitation of degraded lands can increase agricultural yields while minimizing increases in footprint associated with agricultural expansion.
Alternatively, wedges can also be organized around major consumption categories such as food, shelter, mobility, goods and services, along with population size. The footprint of food, for example, might be reduced by optimizing the relationship between the distance it is transported and the efficiency with which it can be locally produced. The energy efficiency of residential and commercial buildings can often be dramatically increased, and utilities supporting them can be integrated so that wastes from one system serve as inputs for another.
The ecosystem approach is defined by the Convention on Biological Diversity as a strategy for the integrated management of land, water and living resources that promotes conservation and sustainable use in an equitable way. The ecosystem approach recognizes the relationships between healthy and resilient ecosystems, biodiversity conservation and human well-being. It sets out a series of 12 principles for decision making and action spanning the environmental, economic and social dimensions of sustainability.
It can be applied on any scale from local to global, and encompasses initiatives ranging from large-scale regional planning, such as integrated river basin management, to sustainable commodities management at the farm level. www.cbd.int/ecosystem/principles.shtml
:: Governments set the policy and economic frameworks within which people must live and the private sector must operate; these must encourage and reward sustainability and promote population stabilization
:: The private sector must be committed to good stewardship of the planet, should be committed to the “triple-bottom-line” approach of economic, social and environmental success, and must provide people with solutions that enable them to live sustainably
:: Civil society needs to be aware of the challenges, elect governments who will set policies in their best long-term interests, and exercise personal choice that demands and favors sustainable produce and products from the private sector.
That was it so far, further recommended reading can be the TEEB report;
The Economics of Ecosystems and Biodiversity
(see the article on Minister of Finance called for further development of economic instruments to protect nature).
A COMMON TRANSECT
This article is very interesting so I can recomend reading it on Representing Transects
-
Great Post. I have always been attracted to the simplicity of the transect and its ability to convey a lot of information, albeit general, in a graphically pleasing way. Applying the transect to the urban growth boundary is a tricky, but I think doable task.
There is a bit of a disconnect between the UGB line on the map and the resulting landscape. The development takes time to catch up with planning. I was driving through Damascus the other day the the farms gave way quickly to the dense neighborhoods. Between those were the remnants of the 3-5 acre rural lots. It was all in all a spotty, hard to comprehend landscape. It would make for an interesting looking transect. What I see happening more and more is the urban growth boundary is not a circle but more of a blob with arms. It would be interesting to see what a transect looks like that starts in the UGB travels through the rural area and reenters the UGB in another arm.
Thanks for the collection of info. Michelle, December 30, 2009 1:24 PM
ABDaigle said...
-
Michelle, I have been thinking about your post, because the application of the Transect to walkable urbanism intends just that - the wave-like action of urban separated by rural (although each "urban" area has its own characteristics and level of urbanism, from hamlet to village to city to regional center).
The primary point is that each "increment" of urbanism must be, at minimum, an approximate 1/4 mile" pedestrian shed" to make it truly sustainable (i.e., meaning most daily needs are within walking distance and rich with a diversity of living, working and shopping opportunities).
This assumes the largest lots are primarily on the neighborhood edge as a transition from urban to rural, adjacent preferably to rural agriculture, and that a mix of ag and preserved "wilderness" likewise separate communities.
This concept can be valid in a number of urban settings, from small town neighborhoods to highly urban areas.
While with PlaceMakers, we designed a community of eight hamlets and saved the majority of land between each one as natural landscape. (The original plan had been to fully develop in sprawl mode the entire land area.) The Waters is outside Montgomery, AL, and hamlet one is well underway. Here is a link to the Master Plan:
http://www.thewatersal.com/WatersMasterPlan.pdf
It is a good example of how one can plan complete neighborhoods, maintain a small town feel while building compactly to ensure walkability, and conserve land. There are many design tools to accomplish similar effects in more urban areas, from conservation easements to urban agriculture to regional parks and greenways.
I love Germany, where the urban edge ends abruptly and agriculture or forests take over. (Large suburban size lots are almost nonexistent there, where efficiency seems to trump other considerations and public shared space is well-designed and abundant.)
Ann Daigle, Community Design & Plan Strategy, March 3, 2010 1:08 PM
THE BLUE ROAD
A link worth checking out is from Dutch artist Henk Hofstra who painted roadways vibrant blue to
symbolize hidden watercourses in the 2007 piece entitled 'The Blue Road'.
ROADS GONE WILD
(from a WIRED article Issue 12.12 - December 2004)
Hans Monderman (Engineer of Livable Streets,) is a traffic engineer who hates traffic signs. Oh, he can put up with the well-placed speed limit placard or a dangerous curve warning on a major highway, but Monderman considers most signs to be not only annoying but downright dangerous. To him, they are an admission of failure, a sign - literally - that a road designer somewhere hasn't done his job. "The trouble with traffic engineers is that when there's a problem with a road, they always try to add something," Monderman says. "To my mind, it's much better to remove things." .......
Riding in his green Saab, we glide into Drachten, a 17th-century village that has grown into a bustling town of more than 40,000. We pass by the performing arts center, and suddenly, there it is: the Intersection. It's the confluence of two busy two-lane roads that handle 20,000 cars a day, plus thousands of bicyclists and pedestrians. Several years ago, Monderman ripped out all the traditional instruments used by traffic engineers to influence driver behavior - traffic lights, road markings, and some pedestrian crossings - and in their place created a roundabout, or traffic circle. The circle is remarkable for what it doesn't contain: signs or signals telling drivers how fast to go, who has the right-of-way, or how to behave. There are no lane markers or curbs separating street and sidewalk, so it's unclear exactly where the car zone ends and the pedestrian zone begins. To an approaching driver, the intersection is utterly ambiguous - and that's the point.
Monderman and I stand in silence by the side of the road a few minutes, watching the stream of motorists, cyclists, and pedestrians make their way through the circle, a giant concrete mixing bowl of transport. Somehow it all works. The drivers slow to gauge the intentions of crossing bicyclists and walkers. Negotiations over right-of-way are made through fleeting eye contact. Remarkably, traffic moves smoothly around the circle with hardly a brake screeching, horn honking, or obscene gesture. "I love it!" Monderman says at last. "Pedestrians and cyclists used to avoid this place, but now, as you see, the cars look out for the cyclists, the cyclists look out for the pedestrians, and everyone looks out for each other. You can't expect traffic signs and street markings to encourage that sort of behavior. You have to build it into the design of the road.".....
In Denmark, the town of Christianfield stripped the traffic signs and signals from its major intersection and cut the number of serious or fatal accidents a year from three to zero. In England, towns in Suffolk and Wiltshire have removed lane lines from secondary roads in an effort to slow traffic - experts call it "psychological traffic calming." A dozen other towns in the UK are looking to do the same. A study of center-line removal in Wiltshire, conducted by the Transport Research Laboratory, a UK transportation consultancy, found that drivers with no center line to guide them drove more safely and had a 35 percent decrease in the number of accidents.
In the US, traffic engineers are beginning to rethink the dictum that the car is king and pedestrians are well advised to get the hell off the road. In West Palm Beach, Florida, planners have redesigned several major streets, removing traffic signals and turn lanes, narrowing the roadbed, and bringing people and cars into much closer contact. The result: slower traffic, fewer accidents, shorter trip times. "I think the future of transportation in our cities is slowing down the roads," says Ian Lockwood, the transportation manager for West Palm Beach during the project and now a transportation and design consultant. "When you try to speed things up, the system tends to fail, and then you're stuck with a design that moves traffic inefficiently and is hostile to pedestrians and human exchange.".....
CHAOS = COOPERATION
1. Remove signs: The architecture of the road - not signs and signals - dictates traffic flow.
2. Install art: The height of the fountain indicates how congested the intersection is.
3. Share the spotlight: Lights illuminate not only the roadbed, but also the pedestrian areas.
4. Do it in the road: Caf�s extend to the edge of the street, further emphasizing the idea of shared space.
5. See eye to eye: Right-of-way is negotiated by human interaction, rather than commonly ignored signs.
6. Eliminate curbs: Instead of a raised curb, sidewalks are denoted by texture and color.
read the full article here
Hans Monderman, Engineer of Livable Streets, died in 2008.This is what Kathy Madden says about his work;
lørdag 24. april 2010
JANE JACOBS WALKS
Jane Jacobs was an urban thinker ahead of her time. When the great thinkers of the day were promoting freeways and auto-centric suburban development, she spotted what was being lost. To her, the best cities and neighborhoods were organic, constantly evolving communities, or networks of relationships. People knew each other and looked out for each other. Walkability was a key component in her vision of what made a city livable. One of her famous lines was that to know a city, or to know a neighbourhood, you needed to walk it.
She died just a few years ago, in her adopted home of Toronto. To honor her, friends in Toronto began the tradition of prompting people to host walks through their neighborhoods, pointed out what they like, or what Jane might have liked. In a recent interview that discussed neighbourhoods and Jane Jacobs, Richard Florida offers some reasons why we might love our home area:
So in essence a neighborhood is not just a set of individuals, but a set of relationships. I think that’s right. And the relationships are fluid. Some are longstanding and some you can plug into and play. And the places that enable those relationships to form are the places that do better.
Every time we come back to these neighborhoods that are exciting, that are great, there’s a long history behind them.
A Jane’s Walk is a chance to learn more of the local history and relationships that made local history. The experience of learning dozens of new things about your own city, and how cities work at the ground level is amazing. This year I’ll also try the experience of hosting, and sharing some recent history of my own neighborhood.
Find one in your city, or offer to host one… Click here for Canada or global cities. In the US try this direct link. They will happen simultaneously across North America and around the world on May 1 and 2, 2010.
Written by Wendy Waters at All About Cities
fredag 23. april 2010
CRACK GARDEN
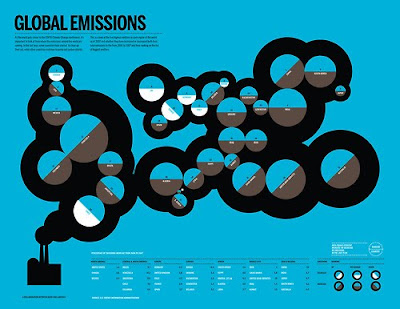
BEAUTIFUL INFOGRAFICS FROM DAVID McCANDLESS
I would like to share some graphics with you (stolen from the book "Information is Beautiful" by David McCandless see: informationisbeautiful.net)
THE LOW CARBON FUTURE AND THE ECONOMY
The Stern Review suggested that developed countries reduce emissions 20-40% below the 1990 levels would be a necessary interim target based on IPCC and Hadley Centre analysis (source: Stern, N (2008), Key Elements of a Global Deal on Climate Change, London School of Economics and Political Science, http:// www.lse.ac.uk/collections/climateNetwork/ publications/KeyElementsOfAGlobalDeal_ 30Apr08.pdf)
Luis Neves Chair, GeSI writes in the foreword;
"The ICT sector has both a profitable opportunity and a critical role to play with other sectors to design and deploy solutions needed to create a low carbon society. I urge you to review this report and focus your efforts on improving energy efficiencies wherever possible, to collaborate with us in steering regulations to
be more productive and to move boldly forward with technologies to improve our global climate. Acting now will be good for business, good for the economy and good for the world."
Summed up:
:: Smart motor systems
A review of manufacturing in China has identified that without optimisation, 10% of China’s emissions (2% of global emissions) in 2020 will come from China’s motor systems alone and to improve industrial efficiency even by 10% would deliver up to 200 million tonnes (Mt) CO2e savings. Applied globally, optimised motors and industrial automation would reduce 0.97 GtCO2e in 2020, worth ¤68 billion ($107.2 billion).4
:: Smart logistics
Through a host of efficiencies in transport and storage, smart logistics in Europe could deliver fuel, electricity and heating savings of 225 MtCO2e. The global emissions savings from smart logistics in 2020 would reach 1.52 GtCO2e, with energy savings worth
¤280 billion ($441.7 billion).
:: Smart buildings
A closer look at buildings in North America indicates that better building design, management and automation could save 15% of North America’s buildings emissions. Globally, smart buildings technologies would enable 1.68 GtCO2e of emissions savings, worth ¤216 billion ($340.8 billion).
:: Smart grids
Reducing T&D losses in India’s power sector by 30% is possible through better monitoring and management of electricity grids, first with smart meters and then by integrating more advanced ICTs into the so-called energy internet. Smart grid technologies were the largest opportunity found in the study and could globally reduce 2.03 GtCO2e , worth ¤79 billion ($124.6 billion).
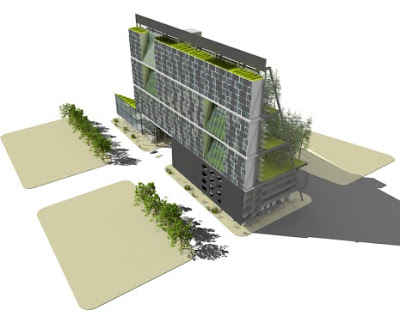
INTERESTING PROJECTS ON TOWER AGRICULTURE
http://nightlybuilt.org/?p=1160
La Tour Vivante
Footprint 1200 sq m / 0.3 acres, height 30 stories, 130 apartments, 8700 sq m office floors, 7000 sq m / 1.7 acres of arable land, 650sq m nursery and library, 6800sq m supermarket, 475 parking places.
One of the most notable designs is made by Paris based Atelier SOA. In La Tour Vivante, The Living Tower, houses and offices are combined with farming in a tight and integrated relationship. This results in a considerable savings in energy use.
The footprint of the tower measures 25×48m and it counts 30 storeys. The net floor space for farming is 7000 sq m or 1.7 acres, which is about 15% of the total. SOA claims that per year about 63.000 kg of tomatoes and 9300 kg of strawberries can be produced. The outer skin of the building has been kept clear of structural elements. Therefore the tower has a massive structural core of 8×30m to carry all floors. The mass of the core is used to store heat in the summer that is used in the winter.
An important feature is the ventilation principle of the building, which is based on the Canadian Well principle. It means that air is sucked into the building through shafts that run underground for a while, allowing the air to heat up in winter or to cool down in summer. When the air reaches the building it will have a stable temperature of around 15 degrees. The chimney effect sucks the air into the building, through the interconnected greenhouses, all the way to the top of the tower. This principle is the main design driver for the building.
The Canadian Well principle is based on the way termite nests are ventilated. The outer skin of the nests is made of thick ground that absorbs the heat of the sun. Before air enters the nest it runs through the damp ground to cool down. Inside the nest the air rises as it gets warmer because of the thousands of termites present, and escapes through a hole at the top.
Energy is generated by photo voltaics and wind turbines on the roof.
Footprint 2900 sq m / 0.72 acres, height 23 stories, 318 apartments, 4050 sq m / 1 acre of arable land in greenhouses and rooftop gardens and a café for organic food.
The design by Seattle based office Mithun for the Centre for Urban Agriculture is entirely driven by self sufficiency. It is said that the grains, vegetables and chickens that the farm produces should be able to feed 450 people annually, which equals the population of the building.
The building is independent from city water and provides its own drinking water. Grey water and rain are collected via the building’s 2900 sq m / 31.000 sq ft rooftop rainwater collection area. It gets filtered and purified by the biomembrane plants in the greenhouses. The energy is generated by 3200 sq m / 34.000 sq ft of photovoltaic cells, regulated over the seasons by storage as hydrogen gas in underground tanks. This matches 100 percent of the building’s energy consumption. This balance in provision and demand for food, electricity and water means that the building is self sufficient in all its aspects.
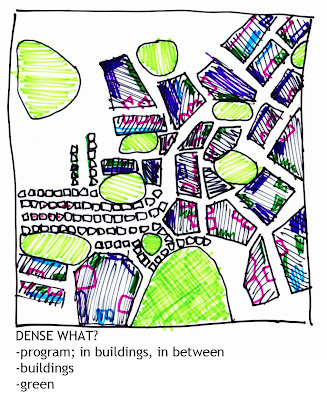
Easy to be skeptic to this type of projects but they can broaden the perspective on "how dense how?" and "dense what?"see: WHAT? WHY? HOW?
INTERVIEW WITH M. CASAGRANDE ON URBAN ACUPUNTURE
How do you as an architect define urban acupuncture?
Urban Acupuncture is cross-over architectural manipulation of the collective sensuous intellect within a city. City is viewed as a complex sensitive energy-organism, a living environment. Urban acupuncture aims into a touch with this nature.
How do you use urban acupuncture to create architecture?
First you have to determine the sensitive flows of the built human environment. Based on those you have to determine the acupuncture points. The last is to determine what is the needle: architecture. The key to understand this is to be presents. To be truly present one has to give up, one has to be weak. To be present is the key of all art.
What are the benefits of using urban acupuncture?
Weakness and flexibility. Communicative action with the collective mind. Environmental sensitivity. Every grass growing through the concrete or asphalt pavement of an industrial city is urban acupuncture.
What requirements should an area meet if Urban acupuncture is to be used as a strategy?
Urban Acupuncture can be applied as networks to deal with a whole city or it can be used puctually in close quaters. If a city is undergoing some sort of an active process or transformation, UA is a good strategy to tune the direction. Acupuncture is good for hardness and industrial insensitivity. Hardness and strenght are death's companions. What has become hard will never survive. Urban Accupuncture can suggest the Dictatorship of Sensitivity.
What is your experience with the use of urban acupuncture? In what context? What were/are the expectations and what was the outcome?
A good case is the transformation process of the Treasure Hill settlement from an illegal urban farming community into a model example of ecologically sustainable urban living in Taipei. See: http://www.e-architect.co.uk/taiwan/treasure_hill_taipei.htm
The process locally was Urban Acupuncture tunning the direction of the collective Qi from destruction into construction and afterwards the whole legalized settlement acting as an acupuncture needle for the modern Taipei. I have been referring this process to the turning over of a compost - something that is considered to be the smelly and repulsive corner of the city suddenly becomes the most fertile top-soil and source of life.
Link: UA
See also; Projet insolite en bambou
And I strongly recommend reading this interview of MC,
teasers to keep you interested; "flesh is more", "in grandmothers we trust"...
FLESH IS MORE
Marco Casagrande has been working with both Sami Riintala and prof. Chi which both is connected to BAS. Sami was our teacher under the shelter course in 2005, and in autumn 2007 I did a course with Chi on micro urbanism (www.microurbanism.net). (see the MICRO URBANISM BOOK" under other works on the left column of this page).
see also if you like;
Chamber of the Post-Urbanist
tirsdag 20. april 2010
SEARCHING FOR RHYTHM, DYNAMICS AND SPACE IN THE URBAN FABRIC
Pictures from VS course at BAS 2005.
(VS description by Gaute Aas;
BAS VISUELL STRUKTUR Autoum 2008 Here are some examples from the teaching process: Teachers; SVEIN HATLØY OG MONA STEINSLAND visual structure–drawing: Oskar Hansen, Architect and artist, professor at the Art Academy in Warsaw. It could be useful to work on a drawing over a longer period – to learn to see. As one (ASP) gave name to the theory ”Open Form” in 1959 on the TEAM X-congress of the traces this is row of practicing, from simple expressions of a few elements in a in Otterlo, Nederland. Oskar Hansen has worked directly from this scheme on closed space, to complex expressions in open form with various objects. the different projects him and his wife Zofia Hansen has developed. He evolved and clarified the visual language through his didactic work, and through his visual structure–“form of space”: engagement at the sculptural classes by the Art Akademy in Warszawa. He has advanced the subject visual structure and worked in order to make a dialog in As professor Oskar Hansen taught it – Looking and Seeing, this is training the ability between and to incorporate together the different subjects -space/ landscape/ and of seeing. As with most of the practices in visual structure, this refers to a situation sculpture. Oskar Hansen had introduced the topic, visual structure and taught the already given, or which is created during the process. Looking and seeing – what subject Visual structure at BAS. What makes you choose what you do? Show it! Here at our school we are operating with a term called DAV (Den Andre Verden time–space: = the other World) – DAV is the key to visual understanding. “Visual Structure” is included under this umbrella. Visual Structure is built upon the teaching of that it is important to create a reflected and controlled relationship between person and form, at the artist academy in Warsaw, by the professor Oskar Hansen*. object, seeing the object walking around it. BAS normaly teach visual structure as an introduction to the 1st year students, visual structure–contrasts: and then more advanced courses throughout the 2nd and 3rd year and as group courses in our 2. Part the 4th class students. Professor Svein Hatløy who teaches Concrete qualities of form characteristics–different types of contrasts between objects. is in collaboration with the other teachers. Of size, of shape, of heavy and light, all presented visually. visual structure–the concept of pressure and tension Bas X was a master course for a mixed group of people coming from other architect schools from different parts of the world. Alle students had a minimum visual structure–open form, dynamic expression, continuity and simultaneity. of 3 years of architect studies before they came to BAS. In one semester we had to go trough every task BAS-students normally takes from the first to the visual structure–by the great number of elements: third year at BAS. But on the basis of our earlier architect studies we already understood the traditional language of architecture. It was an very interesting Making a great number of identical elements legible by adding more elements in a and challenging learning curve understanding the philosophy and thoughts of visual structure, not taking away existing elements. open form and visual structure. The richness in this expression lies both in the number of elements and in their character. The readability lies in an expanding order by a visual structuring. The quality of all the forms, as well as the richness of the whole, would get lost if we take away elements to make it readable. An open form as this will loose its qualities if the elements were restructured into a geometrical order.)
mandag 19. april 2010
MAKING CONNECTIONS
The Parallel City from JAJA on Vimeo.
TROUBLE IN THE SKY
The clouds of ash from the Eyjafjallajökull volcano creeping in over Europe is showing us just how dependent we have made our selves of oil, represented by the aerial traffic. The flexibility and shorted time in travel the planes gives us, including transporting goods and important stuff like organs, makes them almost impossible to replace. The papers tell us about all the things we are running out of due to this incident of nature; organs like a hart needs to be inside its recipient within 4 hours after its last beat if it is to be a successful transplant. Almost impossible unless one live within 4 hours of the hospital doing the procedure, and the organ donor live within 4 hours to that same hospital too. But not only organ transplants have become threatened, if you live out on the islands or far into the fjords of Norway getting to the (right) hospital in time can be a challenge when the ambulance helicopters are stuck on the ground. Lives are suddenly at risk as the aerial traffic is paralyzed and on the ground. But in the future how will we adapt to this change that most likely will come? Oil fuel will become a scarce source of energy and this week shows us how vulnerable we are without it.
In Africa (Ethiopia) they are burning their roses now because without aerial traffic working in Europe they can´t get their product out to the consumers. How weird is that, flying flowers around the world? Things will change if we will make a serious attempt to lower our carbon footprint as dramatically as the goals have been set, to avoid further increased temperatures. What are people willing too give up, and how will they who loose their business adapt?
It will be interesting to see what our local politicians (with Torill Selvold Nyborg, as County Mayor, in charge) decide when they will attempt to agree on a KLIMAPLAN (plan for reducing green gas emissions,GGE) for our county that Bergen is a part of; Hordaland.
The KLIMAPLAN on a world basis is aiming to reduce their emissions based on numbers of 1991. This is argued by many to be quite an unfair share of responsibility. A global fair target will be emission rates pr. person (a footprint based on the individual), would reveal the enormous ecological space some parts of the world takes. GGE for a North American inhabitant is over 25 mill. tons pr year, while for an African it is under 5 mill. tons. A Norwegian based in Hordaland county is responsible for 13,6 mill. tons. If we in Hordaland cut our GGE with 5% every year we will in 2020 be responsible for 7,2 mill. tons individually. (source: Hordaland Naturvernforbund)
Key words to achieve this is short traveled food, bio-energy and a lower energy consumption. And political courage to dispose land and resources smarter in an ecological point of view.
onsdag 14. april 2010
1ST WORKSHOP WITH THE DIPLOMAS
The key words (for my project) after the discussions are;
TIMELINE / SCENARIO
ECO-FOOTPRINT
THE PHYSICAL
They need further development but these are the sketches made as the background for my project (so far);
"2007 we met with Hans in the Netherlands and he told us that although his work started by analyzing why accidents occurred in some areas and why they didn't happen in others, he said that there was one essential goal of calming any intersection. This goal was simply to slow the traffic down to where there could be eye contact between the various people who are meeting each other at the intersection - on foot or in a vehicle. While we were visiting him we had the honor to go with him to several of the intersections that he had worked on and experience them first hand. It was the most remarkable experience to walk through the intersection and, as a pedestrian, have the right of way just prior to bicycles, buses, private vehicles and trucks. One bus pulled up beside us and the driver opened the window and said "Mr. Monderman - I just wanted to thank you for what you did to this street - it works so much better now". Older people were casually riding on bicycles doing their errands and everyone was doing something we had not seen in a long time - using hand signals to indicate when they were turning. The experience we had walking in these "shared" intersections was like walking in slow motion - almost like being in some sort of ballet or slow dance! We have much to thank Hans Monderman for and much to do to utilize if his ideas and experience in US citites today."
Kathy Madden
Project for Public Spaces